
As a .NET developer I wanted to share a tool I return to again and again whether I’m developing new features or squashing bugs. It’s a tool every .NET developer – novice or expert – should have in their tool belt.
The tool I’m talking about is SQL Server Profiler.
What is SQL Server Profiler?
SQL Server Profiler is an add-on to SQL Server Management Studio that allows you to see every SQL request talking to your database. It has the ability to set up filters so you capture only the requests you need.
You can point it to a local or remote database and watch the requests real-time, or log requests to a file for future reference.
Why should I use SQL Server Profiler?
A tool like SQL Server Profiler is a must-have because developers often write code with an ORM (Object Relational Mapper) like Entity Framework, which prevents them from having to write SQL to talk to the database.
ORM’s have many benefits. However, one downside to using an ORM is you can’t see the actual database calls being made. Most of the time this isn’t an issue, but if you are tracking down a bug or trying to figure out a performance issue, using SQL Server Profiler will come in handy.
How do I install SQL Server Profiler?
You can install SQL Server Profiler by following additional installation instructions for SQL Server 2014 Express.
Under Feature Selection be sure to check the Management Tools – Complete option.
How do I use SQL Server Profiler?
To start using SQL Server Profiler open up SQL Server Management Studio.
From the Tools menu select SQL Server Profiler. The SQL Server Profiler window should open up and prompt you to select a server to connect to.
Select your server and press Connect. The Trace Properties window will open. Feel free to change any of the settings, but the defaults should be enough to get you started.
Press the Run button to begin capturing all SQL queries.
Now you are capturing SQL queries you can begin using the application and see what database calls are being made. Click through each of the events as they show up to get more detail.
If you need to see some of the actual results returned from a query, copy and paste it into SQL Management Studio. When it’s done capturing SQL queries press the Stop button at the top of SQL Server Profiler.
Here is an example of a small capture I performed. I used the Ctrl key while clicking on two different rows in the results so that I could see both queries at the same time:

If you would like to see the actual results you can copy and paste this query into SQL Management Studio and execute it like in the screenshot below:
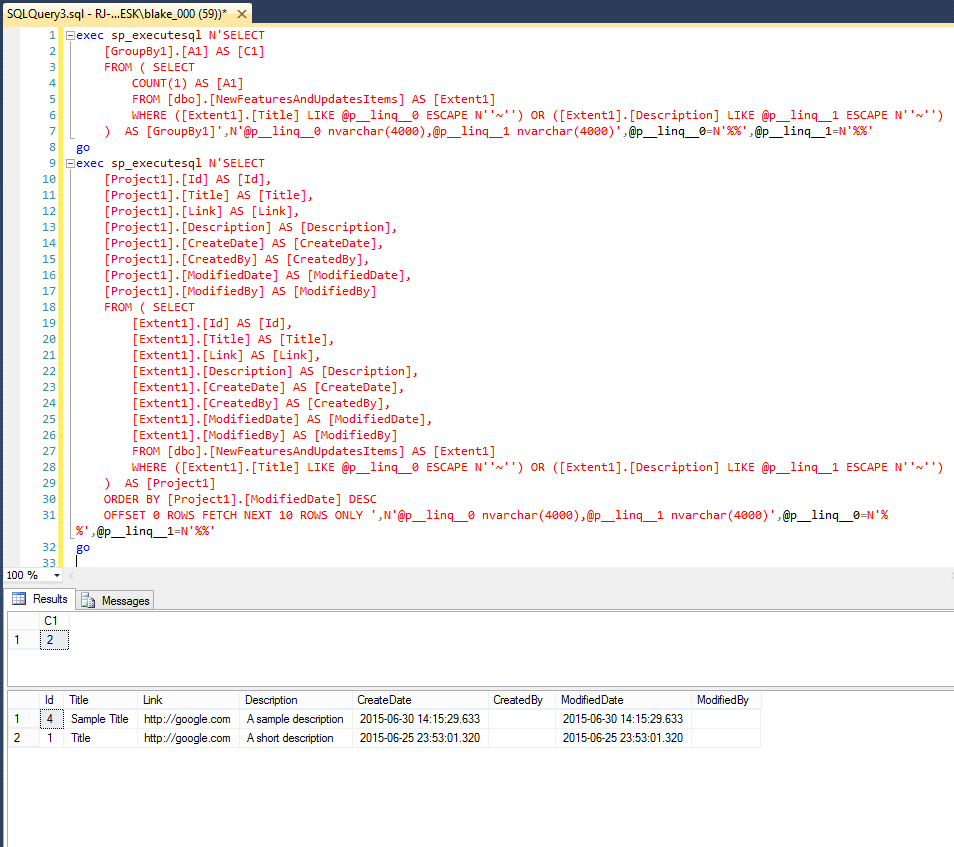
The two statements above are select statements used to get a list of paginated results. The first query gets the total row count and the second query will return 10 results. For this example you won’t see huge performance gains, one potential optimization would be caching the total row count and not asking for it every single time this page is called, especially if it isn’t going to change often.
If you’re using an ORM like Entity Framework it’s important to understand the underlying SQL talking to your database.
SQL Server Profile can help:
- Identify why you have a long running query
- Figure out why an exception is occurring
- Find the actual data that is being used in query statements
If you haven’t had the chance to use SQL Server Profiler please take the time to check it out.
You’ll save valuable time when debugging and learn how to speed up applications.